Music League and the Spotify API
Some friends and I are playing Music League. It’s an online game with ten week-long rounds that have different musical themes. This past week’s theme was “Deep Cuts.” You have a few days to submit the song you think best matches the theme. Music League then turns the submissions into a Spotify playlist and lets you vote on the best matches. Your submission and vote are anonymous until voting ends for that round. When the round is over, Music League reveals the winner and you can see each other’s votes and comments under the submissions.
Andrea started visualizing our submissions with Tableau. For “Hot Off The Press” she plotted every song’s release date on a timeline. For “Global Elites” she put the hometown of every artist on a map of the world.
I knew Spotify had an API and I heard was simple to use. I also knew that Spotify measures the relative popularities of songs and artists. By definition the “deepest cut” should have a low ratio of song popularity to artist popularity. I wondered if I could get that info from the API and rank our submissions by their popularity ratios, and it turns out that’s pretty easy to do.
For the sake of convenience I used Jupyter Notebook. It’s a locally-served web app for running chunks of Python and Markdown in a sequence of cells with shared variables. I used the Python library requests to interact with the API, and matplotlib to visualise the results. The code blocks below are cells copied from my notebook.
In our first cell we’ll import the libraries we need and define our API credentials. To use Spotify’s API you need to register on its website. You’ll then be granted a client ID and client secret for authentication purposes.
import json
import requests
import matplotlib as mpb

CLIENT_ID = ' '
CLIENT_SECRET =  ' '
We’ll use those credentials to get an auth token to inlcude with all future API requests.
auth_endpoint = 'https://accounts.spotify.com/api/token'

auth_response = requests.post(auth_endpoint, {
    'grant_type' : 'client_credentials',
    'client_id' : CLIENT_ID,
    'client_secret' : CLIENT_SECRET
})

auth_data = auth_response.json()
token = auth_data['access_token']
Once we have our token we can build a list of artists and songs from this round’s playlist. Every Spotify playlist has a unique ID that’s visible in its URL when you click the Share button. We’ll use that ID to populate artists and songs in the code below.
headers = {
    'Authorization' : 'Bearer {}'.format(token)
}

playlist_id = ' '
playlist_endpoint = 'https://api.spotify.com/v1/playlists/{}/tracks'.format(playlist_id)

payload = {
        'fields' : 'items(track(name,album(name),artists(name)))'
}

payload_str = "&".join("%s=%s" % (k,v) for k,v in payload.items())
response = requests.get(url = playlist_endpoint, params = payload_str, headers = headers)

playlist_contents = response.json().get('items')

artists = []
songs = []

for track in playlist_contents:
    song = track.get('track').get('name')
    songs.append(song)
    artist = track.get('track').get('artists')[0].get('name')
    artists.append(artist)
The key data we need are the artist popularities and song popularities. Let’s start with artists. We can ask Spotify for info about a specific artist and extract that artist’s ID and popularity score from the response. Those values will be a number between 0 and 100. We’ll loop through our list of artists and collect that info into artist_ids and artist_popularities.
# what we'll use for song and artist data
search_endpoint = 'https://api.spotify.com/v1/search'

artist_ids = []
artist_popularities = []

for artist in artists:
    payload = {
        'limit' : '2',
        'type' : 'artist',
        'q' : 'artist:{}'.format(artist.replace(' ', '+'))
    }
    payload_str = "&".join("%s=%s" % (k,v) for k,v in payload.items())
    response = requests.get(url = search_endpoint, params = payload_str, headers=headers)

    artist_id = response.json().get('artists').get('items')[0].get('id')
    artist_ids.append(artist_id)
    artist_popularity = response.json().get('artists').get('items')[0].get('popularity')
    artist_popularities.append(artist_popularity)

data = zip(artists, artist_ids, artist_popularities)
The recipe for song popularities is almost the same. This time we’ll call the same endpoint with 'type':'track' instead of 'type':'artist' and specify the artist behind each song (to disambiguate between songs with the same name). I’m making a special case for the song “Open Wound.” The submission was ODESZA’s remix but we want the original artist, Ki:Theory.
song_ids = []
song_popularities = []

for song, artist in zip(songs, artists):
    if song == 'Open Wound (ODESZA Remix)':
        artist = 'Ki'
    payload = {
        'limit' : '2',
        'type' : 'track',
        'q' : 'track:{}+artist:{}'.format(song.replace(' ', '+'), artist.replace(' ', '+'))
    }
    payload_str = "&".join("%s=%s" % (k,v) for k,v in payload.items())
    response = requests.get(url = search_endpoint, params = payload_str, headers = headers)
    content = response.json()

    song_id = content.get('tracks').get('items')[0].get('id')
    song_ids.append(song_id)
    song_pop = content.get('tracks').get('items')[0].get('popularity')
    song_popularities.append(song_pop)
We finally have our data! Now it’s time to visualize the specific relationship we’re interested in. There are multiple ways to do this but a bar chart makes sense. We’ll plot song names across the x-axis and the ratio of song to artist popularity on the y-axis.
%matplotlib inline
import matplotlib.pyplot as plt

fig = plt.figure()
ax = fig.add_axes([0,0,1,1])
data = list(map(lambda x,y : x/y, artist_popularities, song_popularities))

zipped = zip(songs, data)
res = sorted(zipped, key=lambda x: x[1])
f_names, f_data = zip(*res)

ax.bar(f_names, f_data, color='royalblue')
plt.title('Deep Cuts Results')

plt.ylabel('Artist Popularity over Song Popularity')
plt.xticks(rotation=45, ha='right')
plt.show()
The code above will generate the figure below.
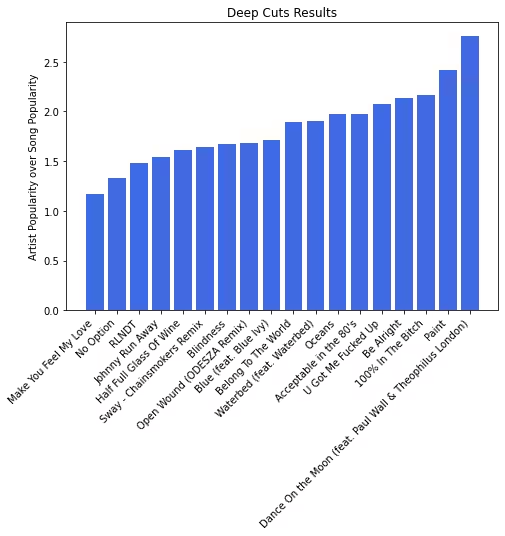
A song whose popularity is much less than that of its primary artist will have a higher score. I think it’s worth noting that this only approximates the idea of “deep cuts” because popularity is hard to reduce to a single number. Tones & I is a relatively unknown artist with one very popular song that boosts their score. “Dance On the Moon” ranks highest because although its main artist is Travis Scott, it’s on a compilation album and not one of his own. The winning entry was “Paint” by Anderson .Paak, a good song and arguably the true deepest cut.